| 2013 Spring Seminar Series on Social Research Methods
Pre-registration and payment of fees is required for all Short Courses.
Please follow these links for details on:
Course Fees
Registration
Certificate of Completion
Statistical Consulting Service
[Click here for Previous Courses]
 Survey Research
|
| Instructor: |
Professor Michael Ornstein |
| Date: |
Monday Apr 29 - Wednesday May 1, 2013 |
| Time: |
9:00am - 12:15pm and 1:00 - 4:00pm |
| Locations: |
Rooms 1004 (lectures) and 1014,
Technology Enhanced Learning (TEL) Building
|
| Enrolment Limit: |
30 |
This course offers an introductory, but sophisticated and complete, guide to survey design. The main focus is on questionnaire design and there are detailed reviews of applied survey sampling, survey pretesting and current strategies of data collection. While no previous background is assumed, the course will also benefit more experienced researchers who are self-taught or have not had exposure to a systematic discussion of contemporary survey methods. The course is designed to teach you how to conduct a small survey.
On questionnaire design, the topics include statistical models of survey questions, the cognitive model of survey response, question formats and response categories, effects of question order, and survey experiments. This theory and research is brought to bear on the measurement of attitudes, socio-economic characteristics and reports of personal experience. Three small group exercises will give you practice in question design. The course covers the basic types of samples and their statistical characteristics and the key decisions about sample structure and sample size. After a discussion of the methods and usefulness of pretesting, the section on data collection focuses on the differences between survey modes, including response rates and data quality, as well as the ability to sample different populations and strategies for increasing response rates, including incentives.
Each day is divided into four blocks devoted to lectures, small group exercises or class discussions.
|
 Introduction to Survey Data Analysis
|
| Instructor: |
Professor Bryn Greer-Wootten |
| Date: |
Thursday, May 2 and Friday, May 3, 2013 |
| Time: |
9:30am - Noon; 1:00pm - 3:30pm |
| Location: |
Room 2114,
Technology Enhanced Learning (TEL) Building
|
| Enrolment Limit: |
25 |
The practical analysis of survey research data is presented in this two-part course. The first day begins with the matrix representation of survey data, including levels of measurement for typical survey questions, the distributional properties of variables and simple descriptive statistics. Subsequently, the construction of scales (e.g., for attitude items) and the fundamentals of statistical inference and hypothesis testing in a survey context are developed.
The second day continues with the implementation of a survey analysis design, including the analysis of groups (e.g., gender differences using t-tests; age or regional differentials using the analysis of variance), and extended analyses of contingency tables, the most common form of data representation in surveys.
On both days, the morning sessions are used for lectures and demonstrations; afternoon lab sessions replicate procedures used in the morning, for a different data set. To benefit from the course, participants should have some background knowledge in basic statistics or the fundamentals of survey research, as well as some prior knowledge of SPSS.
|
 An Applied Introduction to SPSS
|
| Instructor: |
Matthew Sigal, MA |
| Date: |
May 1, 8, 15, 22, 2013 (Wednesdays) |
| Time: |
1:00pm - 4:30pm |
| Location: |
Steacie Instructional Lab, Room 021,
Steacie Science Library
|
| Enrolment Limit: |
35 |
This course aims to acquaint participants with IBM SPSS Statistics, a popular and respected program for analyzing data that is used across a range of disciplines. The curriculum has been recently revised to not only introduce the basic functions and features of the software (including data entry and manipulation), but also to demonstrate how to conduct a range of statistical analyses. Hands-on exercises will supplement the lecture material.
The curriculum for this course is designed to be an applied introduction to a statistical program; as such, familiarity with basic statistical procedures (e.g., t-tests, ANOVA, regression) is assumed. Further, participants are encouraged to bring a USB flash drive to store their work.
Please note that the Steacie Instructional Lab [Steacie 021] is accessed by entering Steacie Library and then proceeding to the basement of that Library.
Because these materials are presented sequentially and build upon the basics presented at the beginning of each day, course participants need to arrive on time and attend the entire sessions.
Please note that food and drink are not allowed in Steacie Library and the Steacie Instructional Lab. The only exceptions are capped bottles of water (not juice/pop) and spill proof mugs (not cups of coffee). Washrooms are available nearby outside the library.
Click here to download the SPSS course data in a zip file.
|
 An Introduction to SAS for Windows
|
|
Instructor:
|
Ryan Barnhart, MA |
|
Dates:
|
May 3,10, 17, 24, 2013 (Fridays) |
|
Time:
|
9:00am - 12:30pm |
|
Location:
|
Steacie Instructional Lab, Room 021,
Steacie Science Library
|
|
Enrolment Limit:
|
35 |
This short course provides an introduction to the Statistical Analysis System (SAS) syntax commands and procedures. We will cover the basics of: reading, transforming, sorting, merging and saving data files in some common formats; selecting cases, and modifying and computing variables; performing some basic statistical procedures and tests such as descriptive statistics, correlations, contingency tables, Chi-square tests, t-tests, ANOVA and linear regression; creating bar charts and scatter plots; composing simple macros for tailored procedures; and saving output results and work in some common formats.
This course is designed for participants with some introductory level statistical knowledge, but no previous experience in using SAS. Please note that while this course will focus on the implementation of introductory statistics in SAS, it is not intended as a review of basic statistics. This short course will get you well underway in using SAS.
Please note that the Steacie Instructional Lab [Steacie 021] is accessed by entering Steacie Library and then proceeding to the basement of that Library.
Because these materials are presented sequentially and build upon the basics presented at the beginning of each day, course participants need to arrive on time and attend the entire sessions.
Please note that food and drink are not allowed in Steacie Library and the Steacie Instructional Lab. The only exceptions are capped bottles of water (not juice/pop) and spill proof mugs (not cups of coffee). Washrooms are available nearby outside the library.
Click here for the SAS course materials.
|
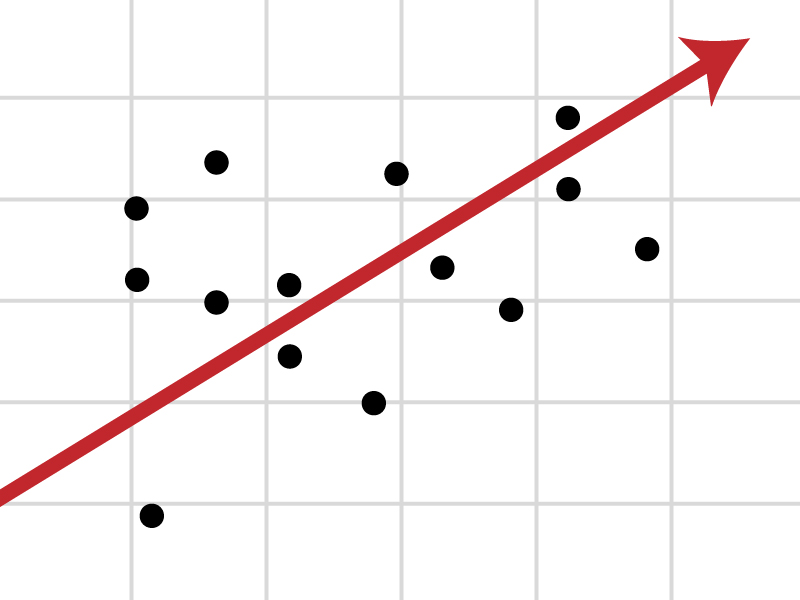 Introduction to Regression
|
|
Instructor:
|
Professor David Flora |
|
Date:
|
May 6 and 7 (Monday, Tuesday), and
May 9 and 10 (Thursday, Friday), 2013 |
|
Time:
|
9:30am - 11:30am (lectures)
1:00pm - 2:00pm (labs) |
|
Locations:
|
| Lectures: |
Room 328A
Behavioural Sciences Building (BSB) |
| Labs: |
Room 159, Hebb Lab, BSB |
|
|
Enrolment Limit:
|
18 |
Linear regression is an essential workhorse for the analysis of quantitative data in the social sciences. Many of the most commonly used methods of data analysis can be expressed in terms of linear regression and regression also provides a basis for many advanced procedures. Beginning with the simple regression model for a single predictor variable, the key concepts of regression will be examined, including model specification and estimation, inference, and diagnostics. This material will be extended to multiple regression models for several predictors, addressing the incorporation of categorical predictors and interactions. All concepts will be illustrated with statistical software. To benefit from the course, participants must have some background in basic statistics and experience with R, SPSS or SAS.
Please note: This course is taught as a lecture-lab combination in the Psychology Department Hebb Lab, 159 Behavioural Sciences Building. You will need to have an active FAS login account for the Hebb Lab (all Psychology undergraduates, graduate students and faculty already have one) to carry out the lab components. A temporary FAS login account for the Hebb Lab for this course will be provided if you do not have one.
Because these materials are presented sequentially and build upon the basics presented at the beginning of each day, course participants need to arrive on time and attend the entire sessions.
|
|
This course has been cancelled.
|
 Visualizing Categorical Data with SAS and R
|
|
Instructor:
|
Professor Michael Friendly |
|
Date:
|
May 14 and 16 (Tuesday, Thursday), and
May 21 and 23 (Tuesday, Thursday), 2013 |
|
Time:
|
2:00pm - 6:00pm |
|
Location:
|
Room 159 (Hebb Lab),
Behavioural Sciences Building (BSB)
|
|
Enrolment Limit:
|
20 |
Statistical methods for categorical data, such as log-linear models and logistic regression, represent discrete analogs of the analysis of variance and regression methods for continuous response variables. This short course provides a brief introduction to statistical methods for analyzing discrete data and frequency data, together with some of the graphical methods which are useful for understanding patterns of association among categorical variables. Some of the topics include: methods for discrete frequency distributions; association plots for two-way tables; correspondence analysis; mosaic displays and friends; effects plots for log-linear models and logistic regression; diagnostic plots for model assumptions; and models for repeated measures.
These methods are illustrated using SAS software based on Friendly (2000), Visualizing Categorical Data, and also with R software, using the vcd package based on that book. For further course information, see http://datavis.ca/courses/VCD/.
This course is designed for people with a basic statistical background and some interest in data visualization. A good working knowledge of the principles and practice of multiple regression is assumed. Some previous experience with either SAS or R is helpful, though not essential.
Please note: This course is taught as a lecture-lab combination in the Psychology Department Hebb Lab, 159 Behavioural Sciences Building. You will need to have an active FAS login account for the Hebb Lab (all Psychology undergraduates, graduate students and faculty already have one) to carry out the lab components. A temporary FAS login account for the Hebb Lab for this course will be provided if you do not have one.
Because these materials are presented sequentially and build upon the basics presented at the beginning of each day, course participants need to arrive on time and attend the entire sessions.
|
 An Introduction to R
|
|
Instructor:
|
Carrie Smith, MA |
|
Dates:
|
May 27 - 30 (Monday - Thursday), 2013 |
|
Time:
|
12:00 Noon – 4:00pm |
|
Location:
|
Room 159 (Hebb Lab),
Behavioural Sciences Building (BSB)
|
|
Enrolment Limit:
|
20 |
R is an independent open source statistical software package that is of value for its wide-ranging pre-programmed statistical procedures and capacity for programming tailored statistical analyses. Also, R is invaluable for generating informative high-quality graphics.
This intensive four-day short course is a step-by-step hands-on introduction to R. No familiarity with R is assumed, but participants will need a basic working knowledge of statistics. Participants will learn how to: 1) install R on their computers; 2) enter, import, and manipulate data; and 3) carry out basic mathematical, statistical and graphical operations and procedures in R. Upon completion of this course, participants will be comfortable with, and able to do, basic statistical work in R. Additionally, they will be familiar with resources for follow-up help and learning about R.
Please note: This course is taught as a lecture-lab combination in the Psychology Department Hebb Lab, 159 Behavioural Sciences Building. You will need to have an active FAS login account for the Hebb Lab (all Psychology undergraduates, graduate students and faculty already have one) to carry out the lab components. A temporary FAS login account for the Hebb Lab for this course will be provided if you do not have one.
Because these materials are presented sequentially and build upon the basics presented at the beginning of each day, course participants need to arrive on time and attend the entire sessions.
|
- For York students, the fees are $45.20 per course.
- For York faculty and staff, the fees are $99.44 per course.
- Full-time students at other post-secondary institutions,
the fees per course are:
| Survey Research |
$271.20
|
|
|
| An Introduction to Survey Data Analysis |
$180.80
|
|
|
| An Applied Introduction to SPSS |
$158.20
|
|
|
| An Introduction to SAS for Windows |
$158.20
|
|
|
| Introduction to Regression |
$158.20
|
|
|
| Visualizing Categorical Data with SAS and R |
$158.20
|
|
|
| An Introduction to R |
$158.20
|
- For external participants, the fees per course are:
| Survey Research |
$497.20
|
|
|
| An Introduction to Survey Data Analysis |
$361.60
|
|
|
| An Applied Introduction to SPSS |
$397.76
|
|
|
| An Introduction to SAS for Windows |
$397.76
|
|
|
| Introduction to Regression |
$361.60
|
|
|
| Visualizing Categorical Data with SAS and R |
$361.60
|
|
|
| An Introduction to R |
$361.60
|
- All participants: Certificate of Completion ........ $5.65 each
See the registration form for payment options.
Refunds are available upon three business days' notice prior to the course start date and are subject to an administrative fee.
Please review our policy regarding refunds here.
Registration
You can register for courses by completing the on-line registration form, which is date-stamped.
You can register in person (weekdays, from 10:00am to 12:00pm or 2:00pm to 4:00pm), please see:
Betty Tai
Room 5075
Technology Enhanced Learning (TEL) Building
To register by mail, print a blank registration form, complete, and send to:
Betty Tai
Institute for Social Research
Room 5075
Technology Enhanced Learning Building
York University
4700 Keele Street
Toronto, ON M3J 1P3
Canada
You may also fax a completed registration form to: 416-736-5749.
Certificate of Completion
Available on request, full attendance is required.
A $5.65 administrative fee applies, for each certificate requested.
Additional Information
Additional information regarding registration, telephone 416-736-5061, weekdays, from 9:00am to 12:00pm or 2:00pm to 4:00pm
Directions to York University (Keele Campus), building and parking lot locations click here. For additional information on parking click here.
Instructors
Ryan Barnhart is a PhD candidate in Psychology at York University with specialization in Quantitative Methods. His research interests and statistical work have focused on longitudinal data analysis using multilevel modeling and generalized linear multilevel modeling. This work has helped Mr. Barnhart develop a multi-platform approach to using statistical software, including SAS, STATA, R and SPSS.
David Flora is an Associate Professor in the Department of Psychology at York University and the Co-Coordinator (with Robert Cribbie) of the Statistical Consulting Service. He received his PhD in Quantitative Psychology from the University of North Carolina at Chapel Hill. His research interests include longitudinal data analysis, psychometric analysis, factor analysis, and structural equation modeling.
Michael Friendly received his doctorate in Psychology from Princeton University, specializing in Psychometrics and Cognitive Psychology. He is a Professor of Psychology at York. Professor Friendly has broad experience in data analysis, statistics and computer applications. He is the author of SAS for Statistical Graphics, 1st Edition and Visualizing Categorical Data, both published by the SAS Institute, and an Associate Editor of the Journal of Computational and Graphical Statistics.
Bryn Greer-Wootten is Professor Emeritus in Environmental Studies and Professor Emeritus of Geography at York University. In 2002 he joined the staff of the Statistical Consulting Service, where he is currently an Associate Coordinator, and in 2004 was appointed an Associate Director of ISR. He has taught and carried out quantitative and qualitative research, with a particular interest in survey research, especially for environmental and social policy.
Michael Ornstein is an Associate Professor of Sociology and Director of the Institute for Social Research, where he is responsible for research methodology. He has a new book, A Companion to Survey Research (Sage, March 2013). Some of his recent research is on socio-economic differences among ethno-racial groups in Toronto, and changes in the pay and composition of occupations. He sits on Statistics Canada's Advisory Committee on Labour and Income Statistics.
Matthew Sigal is a doctoral student in the Quantitative Methods area of Psychology. He is a member of Dr. Michael Friendly's lab and is particularly interested in methods of data visualization, especially in terms of complex multivariate designs. He has been a teaching assistant for both undergraduate and graduate level statistics courses, and taught his own section of introductory statistics in the Winter 2013 semester.
Carrie Smith is a PhD candidate in Psychology at York University specializing in Quantitative Methods. She received her MA in Psychology at York, and BASc in Engineering at the University of Toronto. Her research interests include data visualization and developing robust methods of statistical analysis appropriate for behavioural science data. She has been using R for statistical computing in her research and consulting for several years.
Statistical Consulting Service (SCS)
The Institute for Social Research's Statistical Consulting Service provides consultation on a broad range of statistical problems and on the use of computers for statistical analysis. Its services extend beyond the social sciences to other disciplines that make use of statistics. Consultation is available to assist in research design, data collection, data analysis, statistical computing, and the presentation of statistical material.
Consultation is provided by a group of faculty drawn from York University's Departments of Psychology, Mathematics and Statistics, and Geography in conjunction with full-time professional staff at ISR. The faculty and staff have extensive experience with many forms of statistical analysis. Topics for which assistance is available include regression analysis, multivariate analysis, analysis of categorical data, structural equation modeling, factor analysis, multilevel/mixed modeling, survey data and longitudinal data, experimental design, survey sampling, and statistical computing.
Three times a year, the Statistical Consulting Service offers short courses on various aspects of statistics and statistical computing, including regular introductions to the SPSS and SAS statistical packages. Recent course offerings have addressed factor analysis, structural equation modeling, graphical methods for categorical data, introduction to the R programming language, and mixed models.
The Statistical Consulting Service maintains a regular schedule of office hours during the academic year. The Service primarily serves the York University community; for others, consultation is available on a fee-for-service basis. Please go to the Institute's Web site at www.isr.yorku.ca/scs to make appointments online with SCS consultants.
|